
HRV by Age: What Is a Good HRV for Women Over 40?


My Oura Ring has my 2026 average HRV at 22 ms. My Whoop says my six-month average is 25 ms. One HRV by age chart on page one of Google says a woman my age typically runs 45 to 65 ms while she sleeps. A study of more than 84,000 screened people puts the median for women aged 50 to 54 at 26.6 ms.
So what is a good HRV? If you’ve ever searched after a low reading, you’ve probably hit the same wall I did with my own numbers: every chart gives a different answer and almost none of them were written with a woman in her 40s, 50s or 60s in mind.
I’m 53 and in the menopausal transition. I’ve worn an Oura Ring since 2022. I’ve worn a Whoop since March, I wear a Hume Band and I tested Elonga’s three-minute morning reading for 30 days alongside all of them. Most nights I get three different HRV numbers for the same sleep. This guide gives you the research-based heart rate variability chart by age for women, explains why the published charts disagree with each other by as much as two times and shows why your watch or ring may never match any of them. That last part is the one most guides skip and the part that tells you what a good HRV is for you.
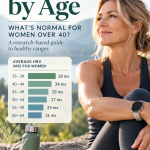
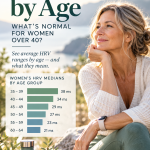
The short answer: using RMSSD, the formula most rings and bands report, the median HRV for healthy women is about 38 ms at 35 to 39, 34 ms at 40 to 44, 29 ms at 45 to 49, 27 ms at 50 to 54, 23 ms at 55 to 59 and 21 ms at 60 to 64. The normal range around each of those numbers is enormous, so your own trend over weeks and months matters more than where you land on any chart.
Table of Contents-Click to Expand
- What Is a Good HRV by Age?
- Average Sleeping HRV by Age: What Your Ring Shows
- What Is a Good HRV for Women in Their 40s, 50s and 60s?
- What Counts as a Good HRV for You
- Average Heart Rate Variability for Women vs Men
- Why the HRV by Age Charts Disagree
- Why Your Watch or Ring Doesn’t Match the Chart
- Where My HRV Sits at 53
- Does Menopause Lower HRV?
- What Is a Low HRV?
- What Does a High HRV Mean?
- What Helps Your HRV
- How I Keep This Guide Current
- HRV by Age FAQ
Disclaimer: Links may contain affiliate links, which means we may get paid a commission at no additional cost to you if you purchase through this page. Read our full disclosure here.
What Is a Good HRV by Age?
So what is a good heart rate variability? A good HRV is one that sits at or above the median for your age and sex, measured the same way every time. That median falls steadily as you get older. Heart rate variability is the tiny variation in time between one heartbeat and the next, measured in milliseconds. More variation generally means your rest-and-recover nervous system has more say over your heart.
What does a higher or lower HRV mean day to day? As Garmin’s HRV Status explainer puts it, higher HRV is generally associated with rest-and-digest mode, while lower HRV usually goes with stress or a fight-or-flight response. So a lower HRV means your body is working harder on something (a hard workout, a short night, a glass of wine, a cold coming on) and a higher HRV usually means you’ve recovered. That’s the day-to-day meaning. Your age sets the range those swings happen in.
The most useful reference values I’ve found come from the Lifelines Cohort in the Netherlands. Researchers took 10-second resting ECGs from 153,793 people, then excluded anyone with cardiovascular disease, high blood pressure, type 2 diabetes or obesity, anyone taking antidepressants, beta blockers or other drugs that act on the vagus nerve and any recording with too much noise or irregular beats. They published RMSSD values by age and sex for the 84,772 who remained (aged 13 to 91), 59.5 percent of them women. You can read the full Lifelines reference values in the European Journal of Preventive Cardiology. Here is their HRV by age data, the closest thing we have to a normal heart rate variability chart for adults, with women first because that’s who I write for.
| Age | Women: median RMSSD | Women: normal range | Men: median RMSSD |
|---|---|---|---|
| 20-24 | 52.1 ms | 11.3 to 205.5 ms | 47.6 ms |
| 25-29 | 47.5 ms | 11.5 to 180.7 ms | 42.3 ms |
| 30-34 | 42.3 ms | 11.5 to 161.0 ms | 36.9 ms |
| 35-39 | 37.9 ms | 10.8 to 141.9 ms | 32.8 ms |
| 40-44 | 33.9 ms | 9.7 to 123.7 ms | 29.0 ms |
| 45-49 | 29.2 ms | 8.3 to 109.5 ms | 26.0 ms |
| 50-54 | 26.6 ms | 7.5 to 96.3 ms | 23.7 ms |
| 55-59 | 22.5 ms | 6.7 to 83.6 ms | 21.0 ms |
| 60-64 | 20.5 ms | 5.5 to 79.3 ms | 19.1 ms |
| 65-69 | 17.8 ms | 5.0 to 83.0 ms | 17.7 ms |
| 70-74 | 18.3 ms | 5.0 to 115.8 ms | 16.0 ms |
| 75+ | 16.1 ms | 3.5 to 106.2 ms | 14.9 ms |
HRV by age reference values (RMSSD from 10-second resting ECGs). Normal range is the 2nd to 98th percentile. Source: Tegegne and colleagues, Lifelines Cohort Study, European Journal of Preventive Cardiology.
Three things jump out of this chart. First, the median for women roughly halves between the early 30s and the early 60s, from 42.3 ms to 20.5 ms. Second, the decline levels off after 60, which is where the Lifelines authors found the median stopped falling. Third, look at how wide the normal range is. A 52-year-old woman at 10 ms and one at 90 ms both sit inside it, which is why I’d never treat a single number from this table as a grade.
Why is the link between age and heart rate variability so steady? The largest look at this question came from 8.2 million Fitbit users, published in The Lancet Digital Health study of HRV in 8 million people. Every HRV measure fell with age. The parasympathetic measures (the rest-and-recover side) fell faster than the sympathetic ones. In women measured between 6 and 7 a.m., high-frequency power, a vagal measure, dropped by about 81 percent between age 20 and age 60. Your recovery system doesn’t stop working, it just has less range than it did at 25.
Average Sleeping HRV by Age: What Your Ring Shows
If your number comes from a ring, band or watch you wear to bed, the fairer comparison is overnight data from other wearers. Two of the biggest ring companies have published member HRV data from 2026 and both run higher than the Lifelines values, which came from short ECGs taken while people were awake and resting. That’s what you’d expect from a measurement taken during your most relaxed hours.
Ultrahuman analyzed overnight RMSSD from about 510,000 ring users (321,532 of them women) across 77 million nights in its HRV by age and gender breakdown. Here’s how its medians line up with Lifelines.
| Age | Women, ring overnight median | Men, ring overnight median | Women, awake resting ECG median (Lifelines) |
|---|---|---|---|
| 20-29 | 46 ms | 52 ms | 47.5 to 52.1 ms |
| 30-39 | 41 ms | 45 ms | 37.9 to 42.3 ms |
| 40-49 | 35 ms | 40 ms | 29.2 to 33.9 ms |
| 50-59 | 33 ms | 37 ms | 22.5 to 26.6 ms |
| 60-69 | 32 ms | 36 ms | 17.8 to 20.5 ms |
| 70+ | 33 ms | 38 ms | 16.1 to 18.3 ms |
Average sleeping HRV by age. Ring values are Ultrahuman Ring medians by decade (overnight RMSSD). Lifelines values are the two five-year medians that fall inside each decade (10-second awake resting ECG). Sources: Ultrahuman, October 2026; Lifelines Cohort Study.
For a woman in her 50s, the ring data puts a typical sleeping HRV around 33 ms, roughly 6 to 10 ms above the Lifelines medians for the same decade. That gap is the best rough guide I’ve found for translating between the two kinds of chart. The ring curve also flattens after 50, dropping just 1 ms from the 50s to the 60s. Ultrahuman points out that its users are self-selected and health-aware, so its medians probably sit a little above a random sample.
Oura’s numbers land in the same neighborhood. Its average HRV page, based on 6 million members from January to August 2026, puts the median for female members at 36 ms across all ages, with an average of 39.1 ms. Oura’s age chart shows the women’s and men’s curves meeting in the mid-50s, a little under 30 ms.
So what is a good heart rate variability while sleeping? If your weekly overnight average sits near or above the ring median for your decade, you’re right where engaged, mostly healthy wearers tend to be. If you sit below it, keep reading before you worry, because your device and your own baseline matter more than the table.
What Is a Good HRV for Women in Their 40s, 50s and 60s?
Putting the Lifelines research and the overnight ring data together, here’s what typical looks like for each decade I write for. Treat these as orientation, not a grade.
A Good HRV for a Woman in Her 40s
On the Lifelines resting ECG, the median for women falls from 33.9 ms at 40 to 44 to 29.2 ms at 45 to 49. Overnight on a ring, the typical woman in her 40s sits around 35 ms. A weekly average in the low to mid 30s on an Oura or Ultrahuman ring puts you in the middle of the pack. This is also the decade perimenopause usually begins, so if your number slides along with new night sweats or broken sleep, the menopause section below is for you.
A Good HRV for Women Over 50
The Lifelines medians are 26.6 ms at 50 to 54 and 22.5 ms at 55 to 59. The overnight ring median holds at about 33 ms through the whole decade. My own numbers sit a little under the Lifelines median and well under the ring median, which I walk through below. The normal range is huge here: on Lifelines, healthy women aged 50 to 54 run anywhere from 7.5 to 96.3 ms.
A Good HRV for a 60-Year-Old Woman
By 60 to 64 the Lifelines median is 20.5 ms and Lifelines found the decline levels off after 60. The ring data has already flattened by then, at about 32 ms. A 60-year-old woman with an overnight average in the high 20s or low 30s is typical. At this age a sudden jump in HRV isn’t automatically good news either, which I explain in the high HRV section.
What Counts as a Good HRV for You
A good HRV for you is one that holds steady or trends up against your own baseline over months, measured on the same device in the same conditions. The age chart tells you whether you’re in the normal range. Your trend tells you whether something has changed.
If you’ve ever typed “what should my HRV be” into a search bar, here’s the framework I use for my own numbers:
- Use the chart once, as orientation. If you sit near or above the median for your age, good. If you sit below it, that’s information, not a diagnosis, because half of healthy women your age do too.
- Read weekly and monthly averages, not single nights. One low night after wine, a late meal or a hard workout means almost nothing on its own.
- Watch for a sustained shift. A drop that holds for a week or two with no obvious cause is the signal worth paying attention to.
- Compare a device only to itself. Switching from one ring or watch to another resets your baseline, for reasons I’ll get to below.
You’ll also see apps fold HRV into a readiness or recovery score. That number is a blend of HRV, resting heart rate, sleep and sometimes temperature, so what is a good HRV score depends on each app’s formula and isn’t the same thing as a good HRV in milliseconds. When I talk about HRV in this guide I mean the raw number.
One more thing that shifts where you land: how much you move. In the Fitbit data, more daily steps went with better HRV in a dose-dependent way across every age and sex. That study was cross-sectional, so it can’t prove the steps caused the difference, but it lines up with everything else we know about fitness and the nervous system.
Average Heart Rate Variability for Women vs Men
On RMSSD, the formula most rings and bands use, the average heart rate variability for women in midlife matches or slightly beats men their age. You’ll read the opposite on a lot of charts because the answer depends on which formula you’re looking at.
When you split heart rate variability by age and gender, the picture is more interesting than most charts suggest. In the Lifelines data, women aged 20 to 45 had a median RMSSD about 5 ms higher than men, the gap shrank to about 2.5 ms between 45 and 59 and it largely disappeared after 60. The Fitbit study found no sex difference in RMSSD at all, while SDRR, a cousin of the SDNN formula, did differ by sex. A meta-analysis of sex differences in Neuroscience and Biobehavioral Reviews pooled 172 studies and found a similar pattern: women had lower SDNN and lower total power but more high-frequency (vagal) power than men.
So if a chart tells you men have higher HRV than women, check which formula it uses. The pooled research finds men tend to run higher on SDNN. On RMSSD, the normal HRV for women is at least as high as it is for men until around 60 and after that the sexes converge. A German study of 1,906 healthy adults aged 25 to 74 in PLOS ONE on HRV by age and gender found no difference in RMSSD or SDNN between women and men in any decade, while many of the sex differences it did find in other HRV measures faded from about 55 on.
The ring data doesn’t settle it either. Ultrahuman’s 510,000 users show men 4 to 6 ms higher at every age, while Oura’s 6 million members show a female median of 36 ms against 35 ms for men. Either way, the spread within your own age and sex is far bigger than any gap between women and men.
If you still have cycles, there’s one more wrinkle. An Oura-based study in the Journal of Biological Rhythms comparing young and midlife women found RMSSD dipped in the late luteal phase (the days before a period) in women aged 18 to 35, but that dip didn’t show up in the midlife group aged 42 to 55. The midlife women also had lower RMSSD overall, which is the age effect from the chart above showing up on a ring.
Why the HRV by Age Charts Disagree
The HRV by age charts disagree because they measure different people, at different times of day, for different lengths of time and sometimes with different formulas. Here’s what four published charts say about a woman around 50.
| Published chart | Who and how it measured | What it says for a woman around 50 |
|---|---|---|
| Lifelines Cohort Study | 84,772 screened people aged 13 to 91, a 10-second resting ECG taken while awake, RMSSD | 26.6 ms median for women 50-54 |
| App-user chart (Welltory and Kubios data) | People who chose to upload readings to HRV apps, RMSSD | About 30 ms median for women 45-54 |
| Whoop member averages | Whoop wearers, who Whoop says skew athletic, measured during deep sleep, not split by sex at each age | 48 ms at 45, 44 ms at 55 |
| A “sleeping HRV” chart from a chiropractic technology company | No source or method cited | 45 to 65 ms typical range at 46-55 |
That’s a spread from 26.6 ms to 65 ms for the same woman. The two large ring datasets in the sleeping HRV section land in between, at about 33 ms for women in their 50s. Most average heart rate variability by age charts you’ll find online fall into one of these camps. Here’s what drives the spread:
- Time of day. HRV is highest overnight and in the early morning. The Fitbit data showed a strong daily rhythm that peaked in the early morning hours, so a chart built from sleep readings will run higher than one built from short ECGs taken while awake.
- Who was measured. Lifelines screened out people with heart disease, high blood pressure, diabetes and obesity but otherwise sampled the general population. Whoop’s own HRV averages page notes its members tend to be athletes and health-focused people. Its overall averages are 62 ms for women and 65 ms for men. App users who upload readings are self-selected too.
- Recording length and formula. Ten seconds, five minutes and a full night’s average are not interchangeable. RMSSD and SDNN also produce different numbers from the same heartbeats.
- Whether there’s a method at all. A chart with no source can’t be checked, so I don’t use one.
I use Lifelines as my anchor because it’s the only one of these built from a defined, health-screened population with a published method and percentiles. The trade-off is that it’s a short ECG taken while awake, so if you’re reading an overnight number from a ring or band, expect it to sit somewhat above the Lifelines median for your age rather than below it.
Why Your Watch or Ring Doesn’t Match the Chart
Your device doesn’t match the chart because each brand measures a different slice of your day or night, while some don’t use the same formula as the chart at all. Here’s how the devices most of you are wearing report HRV.
| Device | Formula | When it measures | Fair to compare with the RMSSD chart? |
|---|---|---|---|
| Oura Ring | RMSSD | Only during sleep, five-minute samples averaged across the night | Loosely, expect it to read higher than the Lifelines chart |
| Whoop | RMSSD | During sleep, weighted toward your deepest sleep | Loosely, expect it to read higher than the Lifelines chart |
| Garmin (HRV Status) | RMSSD | The whole sleep period in five-minute windows, then a 7-day average against your own baseline | Loosely, expect it to read higher than the Lifelines chart |
| Fitbit (Google Health app) | RMSSD | Overnight, most vitals need at least 3 hours of quality sleep | Loosely, expect it to read higher than the Lifelines chart |
| Ultrahuman Ring | RMSSD | Overnight during sleep | Loosely, expect it to read higher than the Lifelines chart |
| Apple Watch (HRV, now called overall HRV) | SDNN | Short automatic readings through the day and night | No, different formula |
| Apple Watch Series 12 Recovery HRV | Not spelled out by Apple | Includes overnight readings compared with your personal baseline | Unknown until Apple says more |
| Elonga | Spectral analysis, reported as scores | Three minutes lying down after waking | No, not reported in milliseconds |
Apple Watch Uses SDNN, Plus a New Recovery HRV
I don’t own an Apple Watch, so this part is research-based. Apple’s own HealthKit documentation for heart rate variability states that Apple Health uses SDNN, the standard deviation of the intervals between normal heartbeats. It has done so since iOS 11 in 2017. That means for most Apple Watch owners, the HRV number in the Health app is a different formula from the RMSSD chart in this guide and from nearly every other by-age chart you’ll find.
That changed in September 2026. With the Apple Watch Series 12 launch, Apple split HRV into two views: Recovery HRV for daily signals of stress and recovery plus overall HRV for broader health, including heart health. Coverage of the update reports that the original measurement carries on as overall HRV alongside a new RMSSD data type. Apple hasn’t stated in anything I could find which formula Recovery HRV uses, so I’m not going to tell you it’s RMSSD. If you have a Series 12, give Recovery HRV a few weeks to build a baseline before reading anything into it. If your watch is older, compare your number only to your own Apple history.
Oura, Whoop, Fitbit and Ultrahuman: Same Formula, Different Slice of the Night
Both Oura and Whoop report RMSSD from your sleep, yet they still don’t agree with each other on me. Oura’s support page on how it measures HRV says the ring only measures during sleep and takes five-minute samples through the night. Whoop’s developer documentation lists its HRV as RMSSD. Whoop calculates it during your deepest sleep.
Over June through September, my Whoop’s monthly averages ran 24 to 26 ms while my Oura’s ran roughly 20 to 23 ms. Same body, same nights, different algorithm and a different part of the night. Neither one is wrong. They’re just not interchangeable, which is why switching devices resets your baseline. I compare the two in detail in my Whoop vs Oura comparison. You can see how each handles recovery in my Oura Ring 5 review and my Whoop review.
Fitbit, now part of the Google Health app, uses RMSSD too, according to Google’s help page on vitals, which says most of its overnight metrics need at least three hours of quality sleep. My Fitbit Air review covers how the newest tracker reports recovery. Ultrahuman’s ring also reports overnight RMSSD and it’s one of the rings I compare in my roundup of Oura Ring alternatives.
Garmin HRV Status: Balanced, Unbalanced, Low and Poor
I haven’t worn a Garmin, so this part is research-based. Garmin’s HRV Status page explains its overnight number using RMSSD, calculated continuously while you sleep in five-minute windows and averaged across the whole night. After about three weeks of overnight wear, the watch builds a personal baseline range and compares your 7-day average with it:
- Balanced. Your 7-day average sits inside your baseline range.
- Unbalanced. It has moved outside your range, either above it or slightly below it.
- Low. It has dropped well below your baseline.
- Poor. Your baseline itself has fallen below age-based standards associated with good health.
Poor is the only one of the four that compares you with other people your age, which makes it Garmin’s built-in version of an HRV by age chart. Garmin’s HRV Status page doesn’t list the age standards behind it, so I can’t tell you where that line sits. Notice too that an HRV well above your baseline counts as unbalanced, not better. More on that in the high HRV section. If you’re choosing a watch, my guide to the best fitness watch for women compares the options.
Elonga: Not Milliseconds at All
Elonga takes a three-minute reading on your forearm while you lie down after waking, then uses spectral (frequency-domain) analysis to score your stress and recovery separately. When I tested it for 30 days, it scored my stress at 4.4 and my regeneration at 3.3 on a good morning, then stress 6.8 and regeneration 2.9 the next morning when my Oura and Whoop also flagged a rough night. Those scores were useful for telling me which side of my nervous system was driving a bad reading, but there’s no age chart you can put them on. My full results are in my Elonga review.
Wearable HRV Gets Noisier After 45
This is the finding that changed how I read my own data. A validation study in Sensors comparing Oura HRV with ECG tested 92 people under 45 and 22 people aged 45 and older overnight. Agreement was strong overall, but on individual five-minute readings more than half of the older group had errors above 10 percent. Averaged over at least 30 minutes or a whole night, both age groups came close to the ECG. In plain terms, if you’re over 45, trust your nightly and weekly averages and be skeptical of any single five-minute reading from a ring or watch. If you want the most accurate reading at home, a chest strap reads your heart’s electrical signal the way an ECG does, while rings and watches read blood flow optically.
Where My HRV Sits at 53
By the research chart, my HRV sits a little below the median for my age. The Lifelines median for women 50 to 54 is 26.6 ms. My Oura yearly view showed a 22 ms average for 2026 when I checked it this spring, after peaking around 26 ms in 2025. My Whoop averaged 25 ms from late March to late September. Against the overnight ring data the gap is bigger. Ultrahuman’s median for women in their 50s is 33 ms, so my Oura’s 22 ms sits about a third below it.
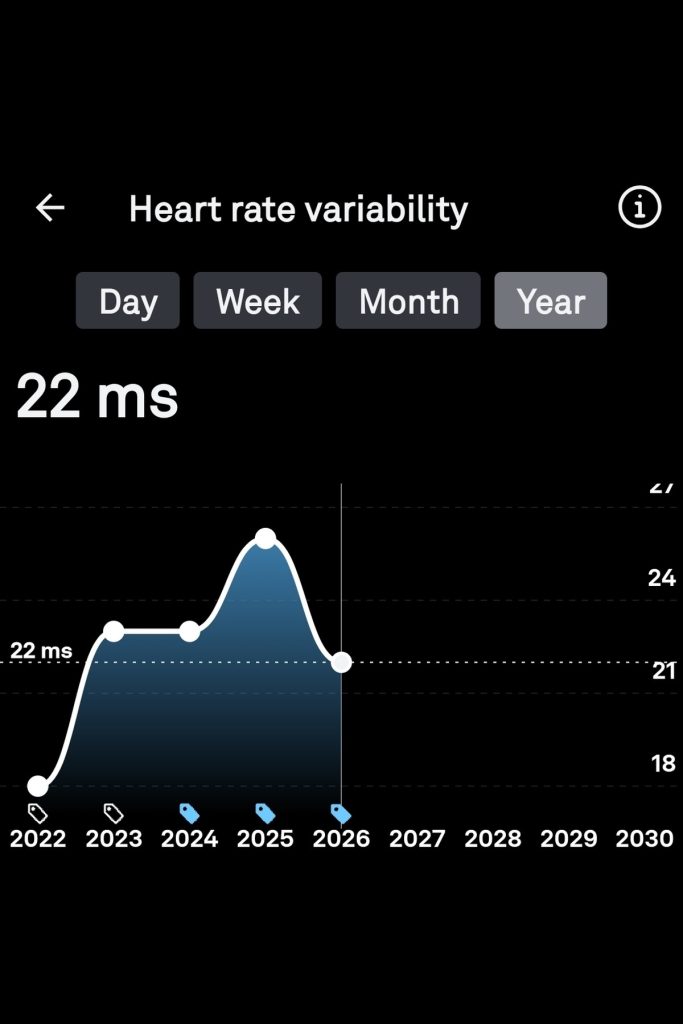

That’s not where I’d like to be, obviously. Both of my numbers are overnight readings and the chart is built from short ECGs taken while awake, so if anything my overnight values should sit above its median, not below it. And because Lifelines excluded people with heart disease, high blood pressure and obesity, its median describes a fairly healthy group. I’m in the normal range by a wide margin, but I’m not ahead of my age group.
What I can’t tell you from my own chart is why this year dipped. It could be age, the menopausal transition, a year with more travel or some mix of all three. One woman’s chart can’t separate those. As you’ll see in the next section, the research can’t fully separate them either. What I watch is the direction over months and whether the habits that move my numbers on a weekly basis (sleep, alcohol, travel) are where they should be.
Your HRV Is Measured While You Sleep
Your ring or band reads your HRV overnight, so sleep is where most of what moves it happens. Get my free Sleep Optimization Checklist and start with the habits most likely to show up in your morning numbers.
Does Menopause Lower HRV?
Age clearly lowers HRV, but whether menopause itself lowers it beyond what age does is still unsettled. The research here splits, so I’ll give you both sides and what I take from them.
On the side of “it’s mostly age”: a study of healthy women aged 40 to 55 in the Journal of Family Medicine and Primary Care compared premenopausal, perimenopausal and postmenopausal women (including small subgroups matched by age) and found no meaningful difference in five-minute HRV between the stages. The authors suggested that age and other factors matter more than reproductive stage, though the study was small.
On the side of “symptoms matter”: a study in PLOS ONE on HRV and menopausal symptom intensity found lower RMSSD in 109 women with moderate to intense menopausal symptoms than in women with mild ones. Those symptoms were scored on a scale that includes physical and mood symptoms, not only hot flashes.
And then the pooled evidence: a 2026 systematic review in Physiological Reports on HRV and hot flashes could only combine three studies, found no HRV difference between women with and without vasomotor symptoms and flagged high variability between those studies. The authors called for larger, standardized research, which is the fair conclusion. A 2026 living review of wearable HRV studies in Sports Medicine landed in the same place: HRV tended to decline after menopause with increasing age, but the studies defined menopause stages too differently to pool.
The thread I’d pull is sleep. In the sleep lab, a hot flash during sleep briefly raised heart rate by about four bpm and cut vagal HRV in a small study of perimenopausal women in Menopause. Women with insomnia during the menopausal transition ran heart rates about four bpm higher all night, even during undisturbed sleep, in a lab study in Psychoneuroendocrinology. They also tended toward lower vagal HRV. Since your ring measures HRV while you sleep, frequent night sweats and broken sleep could plausibly pull down your overnight average, separate from the slow slide that comes with age, though no study has shown that directly on a wearable. If your HRV fell alongside new night sweats or sleep trouble, that’s a conversation worth having with a menopause-literate doctor. My guide to menopause insomnia covers what helps with the sleep side. I wrote about my own Oura data during this stage in my piece on perimenopause anxiety.
What Is a Low HRV?
A low HRV is one that sits near the bottom of the normal range for your age or one that has dropped well below your own baseline and stayed there. There is no official cutoff for a dangerously low HRV. Anyone who gives you a single number is guessing.
The Lifelines data gives a useful anchor. The lower limit of normal (the 2nd percentile) stayed remarkably stable across the lifespan. For women aged 40 to 59 it sits between about 6.7 and 9.7 ms. If your weekly average on an RMSSD device sits at or below those numbers week after week, you’re at the bottom edge of what healthy women your age show. That’s worth raising with your doctor, keeping in mind that a reference built from ECGs and a ring on your finger aren’t measuring identically.
Why does it matter? In people without known heart disease, a meta-analysis of 21,988 people in Europace on HRV and first cardiovascular events found that people in the lowest SDNN group had about 35 percent higher risk of a first cardiovascular event than those in the highest. For low LF power the figure was about 45 percent. The vagal HF measure, the one closest to what rings report, pointed the same way but didn’t reach statistical significance. All of it came from clinical ECGs, not wearables. These studies show an association rather than a cause, but they’re why cardiologists treat persistently low HRV as a risk marker worth noticing.
Low HRV Symptoms
Low HRV doesn’t cause symptoms on its own. It’s a readout, not a condition. What you feel comes from whatever is pulling it down: the fatigue and fog after a short night, the achiness of a cold coming on, the wired feeling of a stressful week. That’s why a low number paired with how you feel tells you more than the number alone.
Why Is My HRV So Low?
Most low readings have an everyday explanation. The usual suspects:
- Alcohol. In 4,098 Finnish employees studied in JMIR Mental Health, alcohol lowered HRV-based recovery during the first hours of sleep in a dose-dependent way, even at low intake, in women and men alike. Being physically active didn’t protect against it.
- Short or broken sleep, including night sweats.
- Illness, often a day or two before you feel sick.
- Hard training without enough recovery.
- Travel and jet lag.
- Psychological stress.
Travel is the one that shows up most clearly in my own data. My Oura average dropped to 14 ms for the first days of October, which lined up with the travel, jet lag and alcohol tags I logged on a long-haul trip to Greece. It’s a good example of a low number with an obvious cause that I wouldn’t read anything into.

What Is an Alarming HRV?
No single HRV number is alarming on its own. What’s worth acting on is a pattern. HRV from a wearable isn’t a diagnosis and a low number on its own isn’t a reason to panic. I’d book an appointment if your HRV has dropped and stayed down for a couple of weeks with no explanation, especially if your resting heart rate is climbing at the same time. Palpitations, chest pain, dizziness or unusual shortness of breath need a doctor regardless of what your ring says. If you wear a Garmin, a Poor status that doesn’t budge for weeks is the watch’s version of the same flag.
What Does a High HRV Mean?
A high HRV usually means good news: your rest-and-recover system has plenty of say over your heart. Youth, endurance training and genetics all push it up. On Lifelines, the top of the normal range for women aged 50 to 54 is 96.3 ms, more than three times the median, so a high number on its own isn’t a problem.
Higher isn’t always better, though. Two exceptions matter more as we get older:
- A jump well above your own baseline. Garmin notes that abnormally high HRV relative to your baseline has been linked with functional overreaching in training, especially from large amounts of low-intensity exercise. If your HRV shoots up during a heavy training block and you feel flat, treat it like a low reading.
- An erratic rhythm that looks like variability. Researchers at Beth Israel Deaconess Medical Center described in Frontiers in Physiology how, with aging and heart disease, a fragmented sinus rhythm can produce short-term HRV that isn’t driven by healthy vagal tone and can confuse traditional HRV analysis. They also found this fragmentation increases with age. A follow-up in 1,963 adults from the Multi-Ethnic Study of Atherosclerosis, also in Frontiers in Physiology, found that higher fragmentation predicted cardiovascular events while traditional HRV measures did not.
These studies used clinical ECGs, not rings. No consumer ring reports fragmentation either, so this doesn’t make a high reading a warning sign. What I take from it is narrower: a sudden jump that stays far above your usual range isn’t automatically good news. If it comes with palpitations or a fluttering or racing heart, mention it to your doctor, because irregular beats can distort HRV readings.
What Helps Your HRV
The habits with the most evidence behind them for supporting HRV in midlife women are regular movement, strength training, protecting your sleep, drinking less and slow breathing. None of them reverse the age curve, but they can keep you higher on it.
- Move every day. The Fitbit data showed better HRV with more daily steps across every age and sex.
- Lift. A 2026 meta-analysis of 60 studies in postmenopausal women in the Journal of Applied Physiology on resistance training and cardiovascular health found resistance training lowered resting heart rate and blood pressure. HRV wasn’t pooled, but the authors’ review of the studies that measured it found modest improvements.
- Protect your sleep. Deep sleep is the window Whoop uses to read your HRV. My guide to how to increase deep sleep goes through the evidence.
- Breathe slowly. A meta-analysis of 223 studies in Neuroscience and Biobehavioral Reviews on slow breathing and HRV found voluntary slow breathing raised vagal HRV during practice, right after a session and after programs lasting several sessions. My piece on the benefits of vagus nerve stimulation has more background.
- Drink less and drink earlier. Even about one drink showed up in the first hours of sleep in the Finnish data.
- Measure the same way every time. One device, worn consistently, read as weekly averages.
If you want more on what HRV is telling you about your nervous system, my podcast conversation with Don Moxley on HRV and recovery goes deeper on the physiology.
How I Keep This Guide Current
The reference values in this guide come from peer-reviewed research, not from my own testing. Every study is linked where I cite it. The device details come from each company’s own documentation. The personal numbers are my own Oura, Whoop and Elonga data, shown in screenshots. Where I haven’t used something myself, like the Apple Watch, I say so. Wearable companies change how they calculate and label HRV more often than you’d think (Apple did it this fall) and the ring companies refresh their member data, so I recheck the device section, the ring benchmarks and the research at least twice a year and note what changed when I update it. Last full review: October 2026.
HRV by Age FAQ
Is 37 a low HRV?
Not for most women over 35. On the Lifelines RMSSD reference values, 37 ms sits right at the median for women aged 35 to 39 (37.9 ms) and above the median for every older age band, including 33.9 ms at 40 to 44 and 26.6 ms at 50 to 54. If it’s an Apple Watch reading, remember Apple Health has used SDNN, so compare it with your own Apple history rather than an RMSSD chart.
Is 26 a bad HRV?
No. 26 ms is almost exactly the median for women aged 50 to 54 (26.6 ms) and above the median for women 55 and older. It would sit below the median for a woman in her 30s, so your age decides whether 26 is typical. Whether 26 is normal for you, based on your own trend, matters more.
Is 22 a good heart rate variability?
For a woman in her late 50s or 60s, 22 ms is right around typical: the Lifelines median is 22.5 ms at 55 to 59 and 20.5 ms at 60 to 64. It is below the median for women in their 40s and early 50s. My own Oura yearly view for 2026 showed 22 ms at 53, which puts me a little under the Lifelines median for my age and further under the overnight ring median of 33 ms.
Is a 43 ms HRV bad?
No. In the Lifelines data, 43 ms is above the female median for every age band from 30 up, where the median is 42.3 ms at 30 to 34 and lower after that. Whoop members skew athletic and average higher, so 43 ms can look middling in that app even though it is above the general population for your age.
What is a good HRV by age on Apple Watch?
There is no trustworthy Apple Watch HRV chart by age, because Apple Health has stored HRV as SDNN since 2017 while most by-age charts use RMSSD. The two formulas aren’t interchangeable. Use your own Apple trend as your benchmark. On Series 12, Apple added Recovery HRV for day-to-day recovery and kept overall HRV for the broader view, so pick one and stick with it.
What do cardiologists say about HRV?
Cardiology research treats low HRV as a risk marker, not a diagnosis. A meta-analysis in Europace of 21,988 people without known heart disease found people with the lowest SDNN had about 35 percent higher risk of a first cardiovascular event than those with the highest. That research used clinical ECG measures, so one low wearable reading is not the same thing. A sustained drop plus symptoms is what to take to your doctor.
Is an HRV of 40 considered normal?
Yes. For women, 40 ms sits above the Lifelines median for every age band from 35 up and close to the overnight ring median for women in their 30s (41 ms in Ultrahuman’s data of 510,000 users). For women 40 and older it is above the overnight median too.
Is 46 ms HRV OK?
Yes. 46 ms is above the Lifelines median for women from 30 on and matches the overnight ring median for women in their 20s. For a woman over 40 it is comfortably above typical.
Is 170 a good HRV?
It is unusual. On Lifelines, 170 ms is above the 98th percentile for women in every age band from 30 up. Young endurance athletes can post numbers like that, but if you are over 45 and see 170 ms, check for a loose fit or a bad reading first and mention it to your doctor if it keeps happening, because irregular beats can distort HRV readings.
What is an alarming HRV?
There is no single alarming number. A weekly average that stays at the bottom of the normal range for your age (about 7 to 10 ms for women 40 to 59 on Lifelines), a drop below your own baseline that lasts a couple of weeks with no explanation or any reading alongside chest pain, palpitations, dizziness or shortness of breath is worth a call to your doctor.
What is a good HRV at night?
Measured overnight on a ring, median HRV for women runs about 41 ms in the 30s, 35 ms in the 40s, 33 ms in the 50s and 32 ms in the 60s, based on 510,000 Ultrahuman Ring users. Overnight numbers run higher than charts built from short resting ECGs, so compare a ring reading with overnight data.
Why is my HRV so low for a woman?
Usually the same reasons as anyone: age, short or broken sleep, alcohol, stress, illness or hard training. In midlife, night sweats and poor sleep during the menopausal transition are a possible extra reason, since rings measure HRV while you sleep. In younger women RMSSD can also dip in the days before a period, though one Oura study didn’t find that dip in women 42 to 55.